Does ideology influence economists' work?
Update: the original graph shown below turned out to be an error. The authors have updated their post with the correct graph. I have an updated discussion of the new graph here. To be clear, there are other measures which they discussed in the paper besides the one presented in that particular graph. To the extent that the discussion below was specifically about that one graph, refer to my new post.
Sure. There are ways in which we cannot help but let ideological considerations affect our work. A researcher must, for example, pick a research question to study, and the questions that sound interesting and important sound that way because of their ideological priors. And for many things economists are asked to do--like, say, derive an optimal tax policy--that cannot be completely separated from a subjective ideological determination. What welfare function do we optimize the tax code against? What criteria define the "optimal" condition? Despite a century of effort, we've not found a truly scientific way to answer these questions--individual-level choices do not aggregate in ways that let us use the standard revealed-preference framework to evaluate these issues.
When you add to that a certain amount of publication bias--not only will liberals study liberal policies and conservatives study conservative policies, but both will only publish those with statistically significant effects--it would be pretty surprising if published results didn't vary depending on the ideologies of authors. Yet, as Kevin Drum points out, that's essentially what we see:

Let me illustrate that point with a different graph. Does this regression line still look like it fits that data?
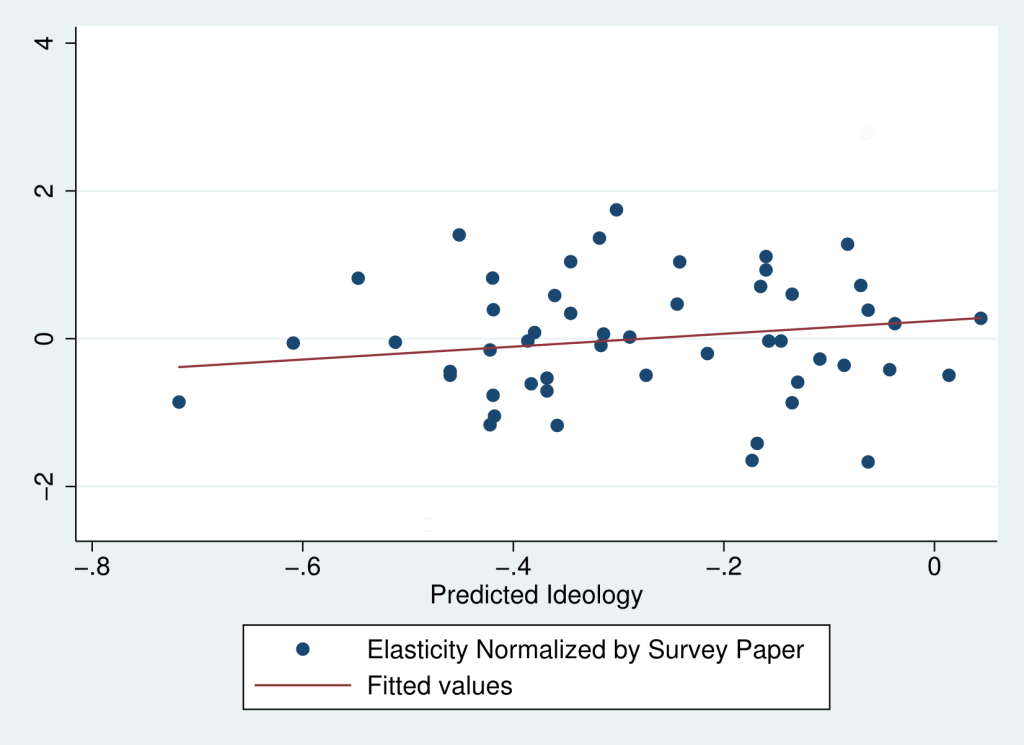
A result that depends on two out of many data points is not a result. My guess is that the p-value was small enough to be statistically significant only because of the way least-squares estimation gives disproportionately greater weight to extreme values than the ones in the middle of the pack, and those extreme values happened to fall pretty far out on their measure of ideology (which, by the way, correctly predicts authors' ideology less than 75% of the time anyway). The term statisticians often use is "robust"--their estimates are not robust, even if the p-value was small. I don't have the raw data to confirm, but it looks to me that as far as the non-outlier data is concerned, there does not appear to be a correlation here.
Side note: Brian Albrecht is right that it doesn't make any sense to claim the slope of the regression line is "small." We're correlating two constructed measures, so the magnitude of the slope has no discernible interpretation. But, the point is that an effect of this size cannot explain a noticeable fraction of the total variation in economists' results.
http://arohatgi.info/WebPlotDigitizer/app/
to produce (Note that I didn't bother to calibrate the units, but it doesn't matter to the analysis):
http://pastebin.com/RQdGYtDg
There's in fact *no significant correlation* shown in the graph. Something really iffy is going on here.
2. I think it's the insidious / invisible aspects of ideology—not liberal/conservative tug-of-war—that drags down economic theory. "Theory blindness", as Kahneman & Tversky put it.