
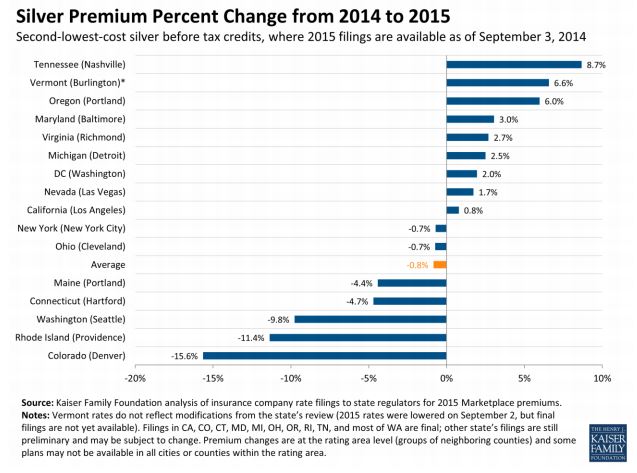
The Kaiser study compared the second-lowest-cost silver plans on the exchanges for 16 cities from 2014 and 2015, finding an average decrease of 0.8 percent from 2014 to 2015. I do have doubts about the dataset itself--it's possible that states that offer more comprehensive data (the criteria for inclusion in this study) are not representative of most states. Time will tell.
But Avik Roy isn't impressed: he cites this McKinsey study finding an 8 percent increase on average between 2014 and 2015. Their methods are similar to Kaiser's, with (as far as I can tell) the only major difference[update] being that McKinsey looked at the cheapest silver plan while Kaiser had looked at the second-cheapest plan (same caveats about incomplete data apply to both). That tells me that estimators of this type aren't very stable, and thus not very useful.
These estimators suffer from compositional fallacies. For example, on twitter Austin Frakt makes an excellent observation:
Empl-sponsored health ins premium growth moderating but cost-sharing rising. Controlling for plan generosity, what's the real growth rate?
— Austin Frakt (@afrakt) September 10, 2014When I think about premium hikes here’s the “ideal” estimator I have in mind: take the premium for each specific plan in 2015 and subtract the 2014 premium for the exact same plan, and then take the average of the differences weighted by the number of 2014 buyers for each plan. This truly tells us the average—not the mostly meaningless “benchmark”—change in premiums while eliminating all confounding compositional effects. It’s also mostly impossible, because the plans offered in 2015 are not the same as the ones in 2014. They never are. Still, I think this is the standard against which various metrics should be compared—a statistic is only valid if it approximates this. Kaiser and McKinsey haven’t got it.
[update] Avik Roy also pointed out this difference in methods between the two studies:
@hyperplanes Kaiser study only looked at cities. That’s useful, but not nationally representative. PwC/McKinsey better for that.
— Avik Roy (@Avik) September 14, 2014
According to the study McIntyre cites, some individuals who would have chosen ED visits when they have no insurance would instead opt for an alternative with insurance (it helps to think of this as a choice between ED and doctor's office, but for our purposes "doctor's office" is just a stand-in for anything other than ED, including no care at all). Let [$]B[$] represent their budget set without insurance, and [$]B'[$] is the budget set with insurance, and denote the choice of ED over doctor's office as [$]e[$] while [$]d[$] denotes the choice of doctor's office instead of ED.[1] The relation [$]C\left(\cdot \right)[$] tells us which element of a given budget set the individual will choose (note that the choice can be a set of alternatives that the individual is indifferent between). Since the study showed that gaining coverage--moving from budget set [$]B[$] to budget set [$]B'[$]--caused some individuals to switch from [$]e[$] to [$]d[$], this implies that we have [$$]e\in B~and~e\in C\left(B\right)[$$] as well as[$$]d\in B'~and~d\in C\left(B'\right).[$$]
Now, the fact that the study observed a decrease in ED visits means we have [$]d\in C\left(B'\right)[$] but [$]e\notin C\left(B'\right)[$] for at least some individuals (if not, then the study estimate isn't causal). What accounts for this difference in choice between the two budget sets?
Suppose that both the ED and doctor's visit are affordable without insurance, so that [$]e,d\in B[$], and that they are both still affordable with insurance [$]e,d\in B'.[$] This would mean we have a contradiction--this says that the consumer simultaneously considers the doctor's office a better option than the ED, while also considering the ED a better option than the doctor's office! If you are familiar with the theory, I'm invoking the Weak Axiom of Revealed Preference (WARP) here. The only way to avoid a contradiction is if either [$]d\notin B[$] or [$]e\notin B'[$]. Assuming WARP holds, whenever anyone says expanding coverage reduces emergency room usage, they are really making one (or both) of two possible empirical statements: that either 1| an uninsured person can afford ED visits but not the doctor's office, or that 2| an insured person can afford the doctor's office but not an ED visit. It would be helpful to know which.
Most studies--including my own dataset comparing ED and clinic visits--suggest that the ED is somewhat more expensive than the alternatives, so it would be a bit weird if [$]d\notin B.[$] Weird, but not totally impossible if you consider, for example, that many doctor's offices will turn away patients that do not have insurance, regardless of whether they can pay in cash. If this is what's driving the result in this study, then we've uncovered a useful policy insight: we can reduce health costs by requiring doctor's offices to accept cash in lieu of insurance. Another possibility is search costs: maybe doctor's offices are actually more expensive than EDs once you include the costs of finding a doctor who will accept you--a process that takes time and effort on the part of patients. It may simply be that EDs are easy to locate, while doctor's are not. That too would be useful to know.
On the other hand, maybe [$]e\notin B'.[$] Although it may sound weird at first that gaining insurance access can mean you can no longer afford to go to the emergency room, but this is actually realistic for some people. Even though insurers pay a portion of the ED bill, consumers are in turn paying the premiums that pay for that portion of the bill, so that having insurance does not expand one's budget set overall. What insurance does do, however, is substitute some elements inside the budget set for some elements outside of the budget set, which would be the case if, for example, insurers require a higher co-pay for ED visits than for the alternatives. On twitter, Seth Trueger offered this bit of evidence for this:
@hyperplanes most do, yes: usually higher ED copays vs others pic.twitter.com/OK9yVTJiLI
— Seth Trueger (@MDaware) September 10, 2014Thus, having a clear theoretical model helps elucidate empirical study of the impact of insurance on ED use. Yes, gaining insurance can reduce ED use, and ascertaining exactly why can reveal important policy implications.
[1] Note, [$]e,d[$] are actually vectors in which just one of the elements represents the choice of healthcare, and the rest of the elements represent the choices of all other goods and services. We are really talking about choices between consumption bundles, which is why it is ultimately possible that getting insurance--whose premium is deducted out of the budget--can make bundles associated with ED use less affordable than without insurance.

While the most infamous examples of health insurance fraud involve Medicare, private insurers like Blue Cross Blue Shield are also hit with tens of thousands of suspected fraud events every year. However, the evidence on the prevalence of fraud is stunningly weak given the apparently enormous scale of the problem. The most widely used estimates hail from the National Health Care Anti-Fraud Association, which suggests healthcare fraud accounts for between $68 billion and $280 billion a year, which as Donald Simborg noted in JAMIA, is astonishing for both its enormity and huge margin of error. Considering that the Coalition Against Fraud estimates total insurance fraud at $80 billion for all industries, this suggests almost all insurance fraud is health insurance fraud. To put that in perspective, the lower bound estimate is higher than all healthcare research and development combined, which clocks in at less than $50 billion according to the CMS.
No doubt the uncertainty about these estimates owes largely to the fact that fraud, by its nature, is hard to catch. But the inconsistency of the estimates may also stem from differing definitions of fraud. Although we typically think of medical fraud as involving identity theft or intentionally billing for drugs and treatments that were never ordered, medical billing errors may represent a much more common experience, as related by this Wall Street Journal coverage of the $10,000 mystery proceedure that the insurer paid for even though it never happened. Billing errors, which may or may not be intentional, aren't always counted as fraud, and seldom lead to criminal prosecutions.
How common are billing errors? As with fraud in general, estimates are sketchy. The most widely cited figure in the media—cited by Consumer Reports—comes from the The Medical Billing Advocates of America, who claim that an outlandish 80 percent of all medical bills contain errors. I've contacted MBAA about their methods and will update if they send a response. This Wall Street Journal piece cites Stephen Parente's much lower estimates of 30 to 40 percent, though I couldn't find this estimate in his extensive published papers (again, will update if he responds to my inquiry). The cleanest published research I found comes from JAMA, and using Medicare data from the 1980s put the estimate of billing errors much lower at between 20 to 14 percent—and falling over time—with over billing exceeding under billing to the tune of roughly 2 percent of total spending.
This over billing may not be accidental. A different study compared providers' medical databases to their billing databases to uncover discrepancies between the diagnoses made and the treatments billed for various conditions. It found low rates of patients who were prescribed but not billed for treatments—1.1 percent for heart failure and 12 percent for hypertension—but very high rates of patients being billed for things for which there was no corresponding record in the medical database—29.6 percent for heart failure and 26.8 percent for hypertension. This method does not necessarily allow us to estimate the rate of billing errors, and there may be legitimate reasons for the discrepancy, but the asymmetry between the two directions of the discrepancy suggests that many billing errors may be deliberate attempts to gouge insurers, which is a form of fraud often not classified as such.
Therefore, despite the poor quality of the data, we do have reason to suspect that healthcare fraud constitutes a significant cost for the typical health insurance policy holder.