Some confusion about multiple equilibria

4/22/2014 01:36:00 PM
Tweetable
Multiple equilibrium models have found some new popularity in the wake of the recession, but I've noticed a lot of otherwise intelligent economists getting it all very horribly wrong.

One of the best kept secrets in economics is that almost any result can actually be intuited by thinking in terms of one or more Edgeworth Boxes. Indeed, almost all the mistakes economists make could be caught if only they had sketched out an Edgeworth Box or two. So here's the Edgeworth box:
A typical Edgeworth box, representing an endowment economy with two agents and two goods, with initial endowments given by w.
Here's how this edgeworth box works. There are two people in the economy, Person A in red and Person B in blue. In the entire economy, there are X units of good x and Y units of good y, and those are the only two goods that exist. The sides of the boxes are axes on a graph: the bottom line tells you how many units of x that Person A has, and is increasing from 0 to X as you read left to right, just like a normal graph. Also like a normal graph, the left side of the box tells you the quantity of good y that Person A has, increasing from 0 to Y as you read bottom to top. Person B's quantities of x and y are denoted on the top and right sides of the box, respectively. The quantity of x that Person B has increases as you read from right to left on the top side of the box, and the quantity of y that Person B has increases as you read top to bottom on the right side of the box, exactly inverse of the case for Person A, representing the fact that whatever Person B has, Person A does not have. To further note how the box works, note that it is rotationally symmetric--if you turn it 180 degrees, you get the exact same box, but with Person B in Person A's position. Thus any point in the graph represents a particular allocation, and you can find out how much of x and y each person has by tracing the point back to each person's respective axes. The curved red and blue lines are called indifference curves, and represent the preferences that person A and B respectively have over combinations of goods x and y. An indifference curve represents the set of all trades that the respective person would be indifferent to--that is, if Person A is at point w on the red indifference curve shown, he would be indifferent to any offer to move him to a different point on that red curve. However, I have only shown one of infinitely many indifference curves for each person, and while individuals are indifferent to points along the same indifference curve, they do have strict preferences over points on a different indifference curve. So for example, Person A strictly prefers any point above and to the right of the red indifference curve shown, and Person B strictly prefers any point to the left and below (from Person A's perspective) of the blue indifference curve--intuitively, "more is better."

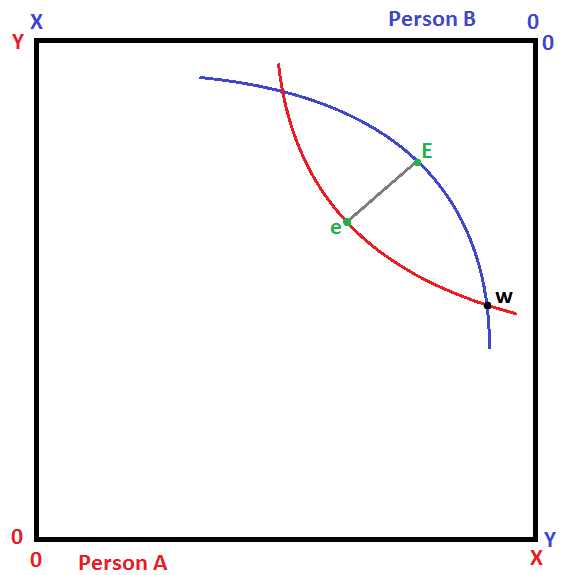
In the edgeworth box above, I've endowed this economy with an initial distribution w that is highly unequal, where Person A has more of y and way more of x than person B. But this is an exchange economy, so they will not stay there. Both A and B want to move to preferred indifference curve, and the lense-shaped region between the two indifference curve represents all the different points where both A and B would be better off than if they stayed at w. The "contract curve" shown in grey, (the line segment eE) represents the set of points where we've exhausted any potential for further gains from trade. The indifference curves at any of those points would be exactly tangential to eachother, so that there is no interior lense-shaped space where both individuals can be better off. Hence, each point on the contract curve represents an equilibrium in this model.

It turns out that multiple equilibria are excruciatingly common in economics. Even in this, the most basic possible model with well-defined preferences, only two agents and two goods, no production, there are infinitely many equilibria. And they cover a pretty large range, from an almost egalitarian equilibrium at e to extreme inequality at E. I've encountered some economists who have argued that the existence of multiple equilibria is a cause of economic inefficiency, or a reason to believe that government intervention would be exceptionally effective. Both claims are totally, inexcusably false. Any point along the contract curve is Pareto Efficient. Moreover, there is no theoretical reason in this model to suppose that any kind of government policy would have any effect whatsoever over which equilibrium Person A and Person B trade to. This model predicts that they will trade to one of the points on the contract curve, but gives absolutely no prediction of any kind as to which of those points.

This gets at the crucial point about multiple equilibria in general: the are a huge problem for economists, but not in general a problem for economies. Multiple equilibria thwart economists efforts at prediction, but they do not imply that the economy is prone to inefficiency, or that government intervention is required--quite the opposite, those kinds of claims would require that the model produce a single unique equilibrium prediction.

On the other hand, none of this is to say that the existence of multiple equilibria inhibit the effectiveness of government intervention. Let's consider a very simple redistribution policy: at initial endowment w, Person A has way more of x than Person B, so let's redistribtue some of that x away from Person A to Person B by way of lump-sum taxation and transfers. Here's that in an edgeworth box:
We redistribute the initial endowment from w to w', which yields a new set of possible equilibria on the line segment e'E', closer to equality.
We've not eliminated the multiple equilibria problem, and there are still infinitely many possible equilibria after we engage in redistribution. But, as you can see by the new contract curve, redistribution is nevertheless highly effective at reducing inequality in this economy. Note, however, that points on the new contract curve e'E' are NOT equilibria of the pre-redistribution exchange economy, nor are points on eE equilibria of the post-redistribution economy. The initial endowment is a model parameter, on which the equilibrium set depends.

The lesson here is this: multiple equilibria inhibit the ability of economists to produce precise predictions. They have nothing whatsoever to do with the effectiveness or ineffectiveness of government interventions, and there is absolutely no basis for claiming that policy can influence which of many equilibria will be realized in the economy.
Anonymous 4/29/2014 07:22:00 AM
Thank you for this. I am an economist turned geek and scheduler in a small economy with no internally circulating money. Now I am searching for what really matters to all people across the globe:

-http://iriewealthonearth.weebly.com