Is the stock market due for a correction?
A friend of mine is worried that the stock market might have a "correction" soon, and is thinking about selling off his stocks in anticipation. Looking at the Dow Jones Industrial Average (DJIA). It's easy to see where this talk is coming from:
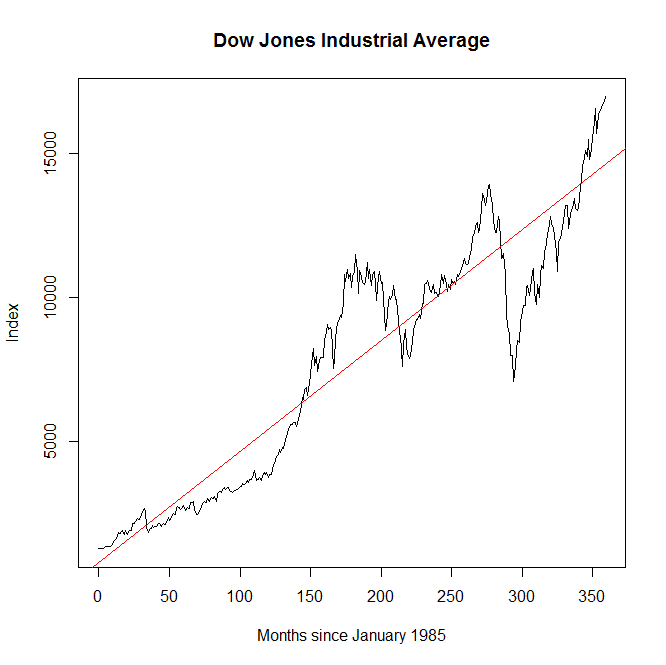
@hyperplanes "regression to the mean"?
— Seth Trueger (@MDaware) July 3, 2014But time series are much trickier than that. Series that don't have regression towards the mean can look quite a bit like series that do. Consider, for example, a random walk with drift:[$$]y_t=y_{t-1}+\alpha+\epsilon_t,[$$]where [$]y_t[$] is this month's stock index, [$]y_{t-1}[$] is last month's index value (a coefficient of 1 means this is a random walk), [$]\alpha[$] is a constant (the "drift" term), and [$]\epsilon_t[$] is this month's random shock, which is normally distributed with mean zero. This process will produce a graph that looks a lot like the stock market with a clear, unambiguous time trend caused by the drift term, and will appear prima facie to exhibit reversion to the mean, because the error term is symmetric--negative shocks are as common and as large as positive shocks, so the index will appear to bounce around a common time trend, on average. But there actually is no One True Trend in this process--all shocks are permanent, being above trend in one period has absolutely no effect on the probability of the index rising or falling in the next period. If, on the other hand, the coefficient on [$]y_{t-1}[$] is less than 1, then the impact of random shocks would diminish over time, resulting in reversion to the mean--maintaining an above-trend index value would require a sequence of increasingly extreme, and thus decreasingly likely, random shocks. That is, when shocks are transitory rather than permanent, being above trend increases the likelihood of a decrease in the stock price--a "correction," if you will.
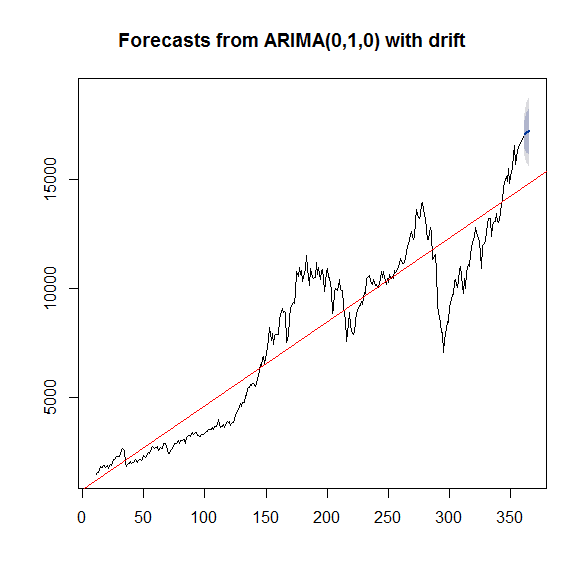
The question above is just a restatement of what is more formally known as the unit root hypothesis. The autoregressive process above, with a coefficient of 1
on [$]y_{t-1}[$], has a unit root, which implies that each realization of [$]\epsilon_t[$] actually shifts the entire time-trend permanently. With a unit root, there is no One True Trend--the observed time trend is actually variable, dependent on the entire history of realizations of [$]\epsilon_t[$] since the beginning of time. And since the next realization will also shift the time trend permanently, whether we are above or below "trend" cannot possibly predict the future direction of the index, ever. It turns out that the (stationary) ARIMA model that minimizes the Akaike information criterion (in a sense, the best-fitting valid model) is an ARIMA(0,1,0) with drift. That corresponds to exactly the equation above, and yes, it has a unit root:[$$]y_t=y_{t-1}+43.7+\epsilon_t.[$$]Sorry folks, but as best we can tell from this one series, the One True Trend is apocryphal, and there is no such thing as a "correction." What we perceive as corrections are actually just totally random shocks. I've plotted the forecast below, and as you can see it does not predict a "correction." In fact, an increase in the DJIA remains slightly more likely than a decrease, despite the fact that we are way above the apparent trend:
To drive home the point, I did a few simulations calibrated to the exact ARIMA process estimated above. Out of slightly more than 100 simulations, here are a few that looked interesting:
 |  |
 |  |
But then again, I did mention that time series are tricky. We must avoid committing the Mankiw Unit Root Fallacy--the fact that our data is empirically consistent with a unit root does not actually imply that all shocks are necessarily permanent and inevitable. A bivariate analysis may detect a combination of transitory and permanent shocks and, either way, there's no reason to suppose that policies can't affect stock values, or that insider information isn't predictive of stock prices. But, what I can say is that if you are one of the many people worrying that stock prices are above trend, stop--your fears are empirically unfounded. Perhaps Bill Gardner said it best:
@MDaware @hyperplanes Shouldn't butt in... but there is no One True Mean. It's prior distributions, all the way down.
— Bill Gardner (@Bill_Gardner) July 3, 2014As always, you can review my data and script file.