I'm quite pleased to see some reaction against using the Hodrick-Prescott (HP) filter to interpret the recent recession here and here; my main regret is that Tim Duy and Paul Krugman did not go far enough.
Figure 1. US Time Series Data
HP filtering is just a statistical technique that is designed to separate various macroeconomic time series--such as real GDP--into two components: a cyclical component representing the business cycle, and a trend component representing the underlying economic potential. Figure 1 plots various time series data for the US without any type of filter. You can see that there is a dominant long run trend in each of the series: GDP (red), consumption (blue), and investment (pink) are all growing over time, while aggregate hours worked (green) has remained relatively flat over time. This is the "trend" component of the time series. But there are also short run deviations from this trend, which causes the time series to look jagged and volatile. This is the business cycle.
Figure 2. Simulated Data from an RBC model.
Why do economists use HP filtering? The reason is that macroeconomics treats long run trends and short run business cycles as completely separate topics. Here's how it works: we start by using the HP filter to "extract" the fluctuations in the data due to the business cycle, then we devise a theoretical model to explain the data, and then estimate parameter values to try to make the results of the theoretical model match the HP filtered data as much as possible. We then do a quick calculation that usually shows that our theory "explains" about 25% of the HP-filtered data, so we pat each other on the back, declare "mission accomplished" and send our work to the American Economic Review with the assertion that we've explained the business cycle. When we use our theoretical model to run simulations of the economy we get something like Figure 2, which if you ask me doesn't look much like Figure 1 at all. Sure there is the right amount of variation in the simulated data, but not the right kind of variation.
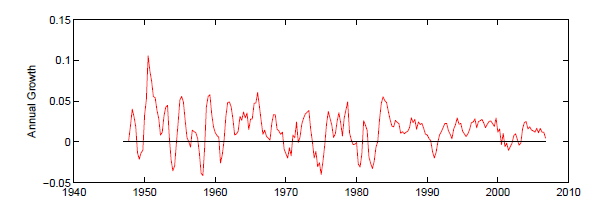
Ok, back up. There is actually a very good reason for using something like the HP filter. Here is the growth rate in (unfiltered) real GDP:
Figure 2. Annual Growth Rate in US Real GDP
You can clearly see that there is a business cycle here, as the growth rates go up and down pretty frequently. However, you can also see that the average growth rate is not centered at zero; this means that I could "explain" about 60% of the fluctuation in the data simply with a model that says that the growth rate is always 3.4%, which is actually considerably better than what is usually reported in macro papers. Obviously, though, while this model is a reasonable fit for the data overall, it does not explain any of the business cycle fluctuations. So to assess how much of the business cycle a particular theoretical model explains, we need to define how much of the fluctuation in the data represents the business cycle, and how much represents the long run trend.
One way to do this would be to simply subtract 3.4% from the annual growth rates in the data, and then assume that the remainder is the amount of the fluctuation that is due to the business cycle. Of course, you could argue that 3.4% is arbitrary, and that the trend growth rate itself fluctuates over time. And this is where the macroeconomic research begins to loose its sanity. I don't object to the basic premise--the trend GDP probably does fluctuate over time. The problem is that HP filtering attempts to figure all this out based only on a single data series--in econometrics, we would say that our model suffers from under-identification. We are attempting to extract more information from the data than it contains. Ultimately, the way we do this is by making certain "identifying assumptions"--in the case of HP filtering, we assume that the trend GDP must satisfy a specific degree of "smoothness," and that any fluctuation that violates this smoothness must be the volatility due to the business cycle.
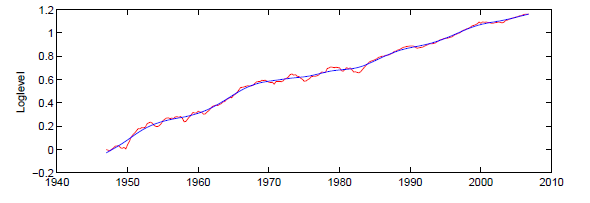
Figure 3. US real GDP (red) and HP-filtered "trend" GDP (blue).
Figure 3 shows what happens when you make these assumptions. In fact, most of the fluctuation in GDP is assumed to be due to fluctuations in trend, with the business cycle causing only small, short lived deviations from the trend. And this is exactly the problem.
So here are some challenges to the conventional paradigm of HP-filtering: first, if the HP trend is supposed to represent potential GDP, why would we always assume that it fluctuates less than the overall business cycle? Wouldn't it be possible that the actual fluctuation in GDP would be less than the fluctuation in potential GDP? That actually makes a bit of sense to me, since economic agents tend to be too slow to adapt to technologies or other fundamental changes, not too fast. Second, why would we assume that potential GDP is pro-cyclical? Sure, we could argue that prolonged depressions destroy capital, for example, but why would we filter that effect out of the data, rather than include it in our model? And, given that we believe that the fluctuation in the business cycle is in addition to the fluctuation in the potential GDP, there ought to be plenty of instances where actual and "trend" GDP move in opposite directions, which never happens with HP-filtering.
Now, this is not to say that HP-filtering should never be used to look at the business cycle, but I do think it is fair to say that if your argument depends mostly on how the HP filter interprets the data, then you are probably wrong. (James Bullard, this means you)